February 10, 2020 Water Level Update
Over the past week, well above normal temperatures continued across much of the Great Lakes basin.
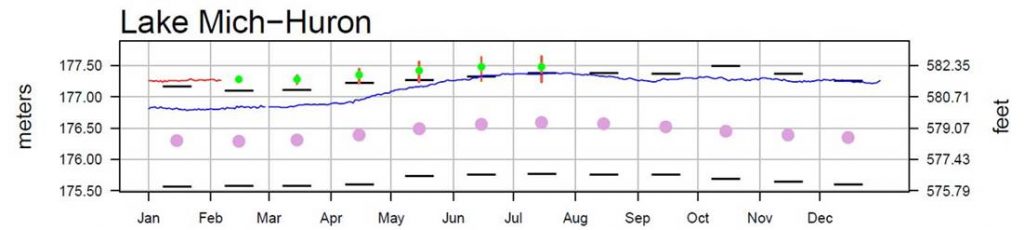
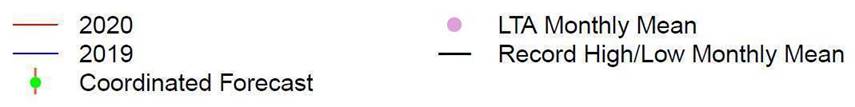
Water levels continue to be well above average and near record high levels. From a month ago the water level on Lakes Superior is 3 inches lower, but Lakes Michigan-Huron, St Clair, Erie, and Ontario are 1, 7, 9 and 6 inches higher, respectively. Lakes Superior, Michigan-Huron, St. Clair, Erie & Ontario are 3, 18, 17, 14 & 7 inches higher respectively than they were at this time last year, and 15, 39, 43, 37 & 20 inches, respectively above their long term February average. Lakes Superior, Michigan-Huron, St Clair and Erie are currently1, 6,3 & 6 inches, respectively higher than their previous record highs for February. In a month’s time, the level of Lake Superior is expected to be down by 1 inch, Lakes Michigan Huron and St. Clair are expected to be unchanged, and Lakes Erie & Ontario are expected to rise by 1 and 4 inches, respectively.
Outflows from Lake Superior into the St. Mary’s River and Lake Michigan-Huron’s outflow into the St. Clair River are predicted to be above average for February. Lake St. Clair’s outflow through the Detroit River and Lake Erie’s outflow through the Niagara River are also forecasted to be above average in February. In addition, Lake Ontario’s outflow through the St. Lawrence River is projected to be above average for February.
High water levels and potentially record high water levels are expected to persist for at least the next six months, so flood prone areas are expected to remain vulnerable. Water levels and flows in the connecting channels can be significantly impacted by ice during the winter months.
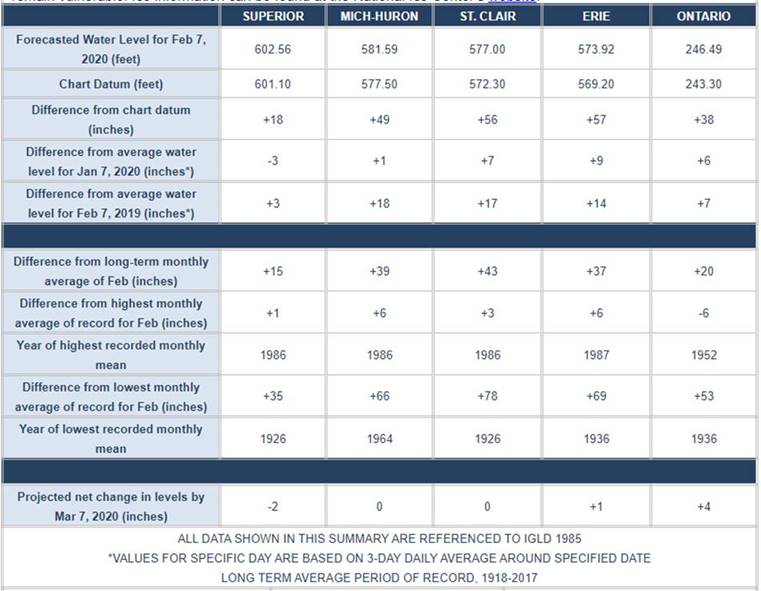
The current USACE 6 month prediction graph has now been updated with actual levels, as below. It should be noted that USACE predicts that the most likely outcome is that levels will exceed last year’s high in July by 5.3”. It looks as if there will be less ice cover and therefore more evaporation than there was last winter. However, if precipitation is much the same as last year over the next 5 months, then water levels will likely be nearer the top end of the predicted range (orange area in graph below) – which shows 13” above last year’s high in July.

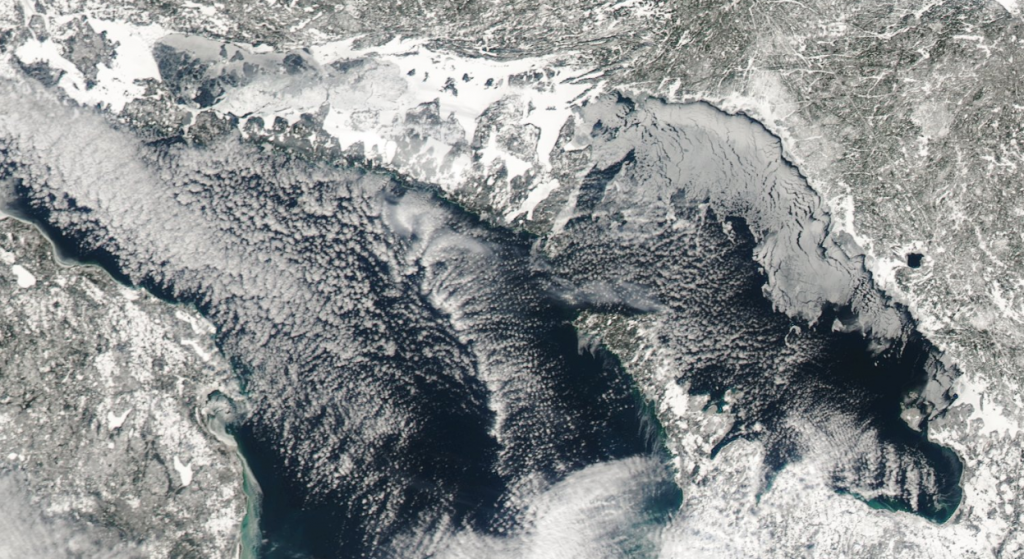
Ice cover is late this winter, but the satellite image below from yesterday shows that ice is now staring to form over about 40% of the Bay and the North Channel is almost completely covered.
 Woods Bay Community Association